Surface Analysis Study of Laser Marking of Aluminum
Abstract
Nowadays, traceability combined with robust and permanent identification of industrial parts is becoming a crucial element of the manufacturing processes. Laser marking of metal parts is a technology showing many advantages compared to labelling, inkjet or dot peen marking. Advantages include no consumables, faster cycle time, reliability and repeatability of the process and robustness of the marks. In this paper, we aim to study the physics involved behind the process of laser marking on aluminum. The marking is generally made in black surrounded by a white background applied to increase contrast. We show the results of a surface study for both surface whitening and blackening performed with a Dektak surface profiler and a scanning electron microscope (SEM). A physical explanation of the whitening and blackening of the aluminum is provided - based on these results. Different characteristics of the surface are also discussed with regards to the laser parameters. The results explain why a blackened and a whitened surface do not scatter light the same way. The whitening is produced by the surface texture of small amplitude which creates a diffuse reflection. The blackening is produced by a surface texture of greater amplitude that increases the coupling of the light within the material.
1. Introduction
Many manufacturing industries require marking their parts with information such as product serial number, production date, bar code or corporate logo. Several methods can be used to do so, such as labeling, inkjet printing, dot peen marking and laser marking. This paper focuses on laser marking because this technology shows many advantages compared to the others, such as high speed, permanent marks, non-contact technique, consumable-free and easy maintenance. The powerful focused light energy supplied by the laser modifies the surface of the materials. With the optimization of certain parameters, it is possible to create high contrast markings on an aluminum surface.
Several parameters influence the way the laser beam interacts with the materials. First of all, the material properties such as the absorption coefficient, thermal diffusivity, melting and evaporation point are important. These parameters are intrinsic to the materials involved and often may not be changed. On the other hand, laser parameters, such as power, wavelength, pulse duration and frequency can be optimized to produce the best marking based on pre-defined criteria. For instance, marking speed is often the limiting criterion. It is therefore possible to optimize the marking parameters to ensure the code is marked as fast as possible while ensuring that it remains readable.
In this article, we study the surface modification generated by laser marking on aluminum 6061. The laser used to obtain these results is a Q-switched pulsed fiber laser. This laser operates at a wavelength of 1.06 μm and provides an average output power of 100 W. This wavelength is highly suitable for marking metal such as aluminum because it allows relatively high absorption.
2. Experimental Setup
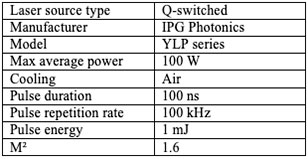
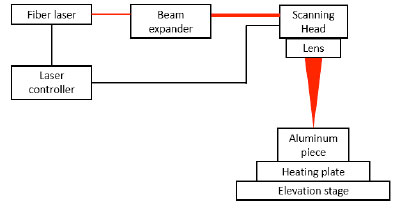
The characteristics of the laser used are presented in Table 1. A schematic of the setup is presented in Figure 1. The laser goes into a beam expander that magnifies its size to approximately 10 mm (@ 1/e2). It passes through the scanning head and then into a lens that is used for focusing the beam onto the surface. The sample is placed on a heating plate to assess the effect of temperature. The fiber laser and the scanning head are controlled by a computer to mark a matrix of squares. This matrix is used to study different combinations of speed and line spacing. Two different lenses with focal lengths of 420 mm and 160 mm were tested for temperatures between 25 °C and 400 °C. The contrast, which is defined by the difference between the grey level of the white and the black, is evaluated by analyzing photographs of the sample taken under a white light at 20° from the vertical.
In order to better understand the physics behind the marking process, the surface of selected samples from the matrix was studied. The first characterization was performed with a Dektak 150 surface profiler. This provided a 2D profile of the surface. The measurements were done perpendicular to the line inscribed by the laser. The second characterization was done with a scanning electron microscope (SEM). The images obtained show the topography of the surface of the sample and how the laser had altered it.
3. Results
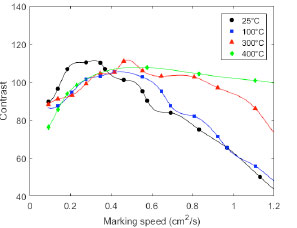
The contrast of the laser marked identifier is defined by the grey level of the white (perfect white has a grey level of 255) minus the grey level of the dark (perfect black has a grey level of 0). This contrast is dependent on the marking speed. We can see in Figure 2 the relation between the contrast and marking speed for different temperatures. It needs to be pointed out that more time for marking does not necessarily mean better contrast. There is in fact an optimal speed at which the maximum contrast is obtained, and this speed increases with the material temperature [1].
The results shown in this paper aim to explain the relation between the surface morphology and the corresponding grey level of the marking. An example of a typical surface profile is presented in Figure 3. The three sections that can be seen there represent respectively the surface without treatment (from 0 to 2000 µm), the whitening process (between 2000 µm and 3000 µm) and the blackening process (over 3000 µm). Profiles of multiple samples have been measured. From these results we can extract different parameters that describe the surface. The most relevant for our study is the root-mean-square roughness (Rq) and the average height difference between the five highest peaks and the five lowest valleys (Rz). The Rq and Rz were measured for samples with different marking parameters.

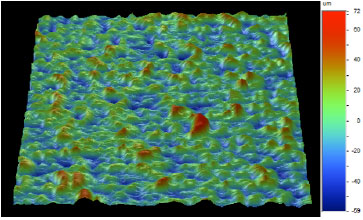
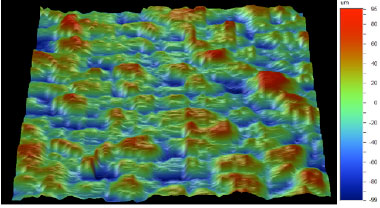
High resolution 3D images obtained with the Dektak 150 are presented in Figure 4 and Figure 5, for material temperatures of 25 °C and 400 °C, respectively.
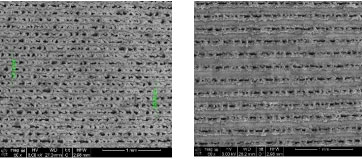
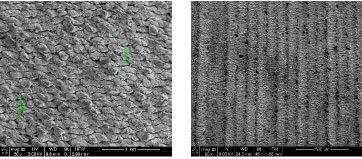
SEM images at 25 °C and with line spacing of 0.125 mm and 0.225 mm are presented in Figure 6 (left and right, respectively). Figure 7 shows a blackened sample at 400 °C with a line spacing of 0.125 mm on the left and a whitened sample on the right. In Figure 6 we can calculate a distance between lines marked by the laser of 0.124 mm and 0.222 mm, which corresponds to the line spacing of 0.125 mm and 0.225 mm used.
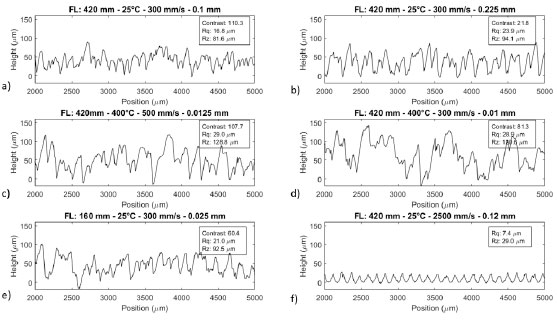
Surface profiles are presented for 6 different samples in Figure 8.
4. Discussion
4.1 Whitening
Metals have an important characteristic that happens to influence the way light interacts with them. When a ray of light encounters an air-metal interface, a significant fraction of the light is reflected while the rest is absorbed. The reflectivity is the characteristic that quantifies the amount of light that is reflected at the interface. Metals are known to have high reflectivity. The uncoated aluminum can have a reflectivity close to 1, which means that almost all light is reflected on the surface. The reflection on a mirror-like surface is said to be specular. That means that light is reflected in only one direction. Specular reflection is illustrated in Figure 9a. This is partially what is happening on a non-treated metal surface.
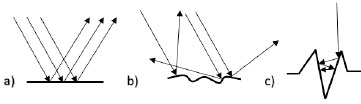
We can see in the Figure 3, between 2000 µm and 3000 µm on the X axis, the surface of a whitening sample. Figure 8f also shows a whitened surface on a different scale. We can see a regular pattern of peaks with amplitude around 29 µm. This modification of the surface is changing the scattering of light on the sample: The partially specular reflection obtained on an untreated surface now becomes a totally diffuse reflection (as shown in Figure 9b). The different rays of light that arrive on the surface are not all reflected at the same angle because they do not arrive at the same incidence angle on the surface. The surface appears white because all the wavelengths of the visible spectrum encounter diffuse reflections.
4.2 Blackening
Blackening is achieved by the same technique as whitening, but with different laser parameters (generally the marking speed is slower for the blackening). In Figures 4 and 5 we can see a 3D image of the morphology of the surface of two blackened samples. The major difference with the whitened sample is that the distance from peak to valley is much larger. In fact, we have determined that the whitened sample has distanced peak-to-valley of approximately 25 μm while we have found 90 μm for the blackened sample at 25 °C. We think that this is the explanation of the black coloration. To explain this phenomenon we have to refer to Figure 9c. We see on this figure that the shape of the surface tends to guide the light in the material instead of reflecting it in the opposite direction. This is what we call material coupling. At each reflection there is more light absorbed by the metal. The light is trapped in the material and this is why we see it black.
We can also see that the peaks on a blackened surface are higher than the original surface. This shows a different interaction between the laser and the materials. Because of the lower marking speed of the laser, much more energy is given to the surface. This energy is absorbed and transformed in phonons that increase the material temperature. The energy absorbed by the surface is enough to cause an expansion of the material. This phenomenon is more present at a higher temperature. This is why the Rz is greater for the samples at 400 °C than at 25 °C like we can see in Figure 8c and d.
4.3 Influence of laser parameters
Now we must ask ourselves what makes the contrast greater with some laser parameters than with others, if the surface roughness is similar. It is really dependent on the line spacing. If the line spacing is too large, the lines marked by the laser are well defined, but an unaffected space remains between them so that light that is reflected in these spaces is not coupled with the materials. Partially specular reflection remains between every line within the blackened areas, thus affecting the global grey level of the blackened area and so the overall contrast as well. This effect is clearly shown on the SEM images of Figure 6. We can see on the right image that there is a space between lines made by the laser where the surface is not affected.
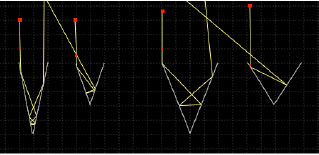
Absorption in a trap is dependent on the number of reflections that the light undergoes before it gets out. The more reflections it undergoes, the less light can escape [2]. The number of reflections depends on the ratio of the depth and the width. We can see in Figure 10 that a deep and wide slit results in several reflections. For instance, if only 5 % of the light is absorbed at each reflection, 36 % of the light will get out for 20 reflections and 13 % for 40 reflections.
Absorption of light is highly dependent on the morphology of the surface. The roughness provides an idea of the texture of the surface. According to our analysis of the trapping of the light inside a material, it is logical to think that a rough surface will produce a high coupling and therefore a black surface. In fact, the black surface has a roughness 5 times greater than the white surface. However, it does not seem to explain the difference in contrast between the different blackened markings.
The morphology of the samples must be observed more carefully. In fact, for equivalent roughness two samples can have really different morphology. We can observe in Figure 8a and 8e the profile of two samples. The first is done with a 420 mm FL lens and the second with a 160 mm FL lens. The main difference is that the laser spot size is smaller for the 160 mm FL lens. With this configuration, no contrast better than 60 was achieved. However, the sample with the 420 mm FL lens has a contrast of 110. Two reasons explain this: The sample obtained with the 420 mm FL lens has more peaks per unit length and these peaks are narrower, thus resulting in more reflections and more effective material coupling. Our observation of different samples obtained with the same focal length lens also confirmed that the narrower the peaks generated on the surface, the more the surface appears black.
5. Conclusion
Laser whitening and blackening of aluminum surfaces has been studied. The difference between the two processes has been revealed by the morphology of laser modified surfaces. The whitening is produced by a relatively small alteration of the surface with the laser leading to diffuse light. The blackening results from a more important surface modification increasing the coupling of the light within the material. The laser spot size and the sample temperature are also impacting the surface alteration and at the same time the observed contrast. Good contrast can be achieved at high temperature provided that the marking speed is high enough. In addition, large line spacing is also leading to low contrast due to white space between lines.
References
1. Alex Fraser et al., Important considerations for laser marking an identifier on aluminum, Light Metals 2016, 261-264.
2. Matthew S. Brown and Craig B. Arnold, Fundamentals of Laser-Material Interaction and Application to Multiscale Surface Modification, Laser Precision Microfabrication, Springer Series in Materials Science, 135, 2010.