Inline Integration of Shotblast Resistant Laser Marking in a Die Cast Cell
Abstract
In the last few years, high costs related to car recalls by automakers has significantly increased demand for individual traceability of components and die castings are no exception. As a result, requirements for unique identifier marks on especially high-integrity parts are becoming more and more common in the industry. These marks usually take the form of a 2D Data Matrix Code (DMC).
Besides the OEM’s needs, there are also important advantages for part manufacturers to have individual and unique serial numbers marked on each part. It allows the manufacturer to know exactly when and where a specific part has been produced—defective or not. Every part can be traced back to the processes and environmental parameters. Manufacturers can also use this information for process improvement and tracking every part that encountered similar situations.
To correctly identify parts and avoid any possible mix-up, the marking must be done inside the die-casting cell, right after its removal from the mold. When the die castings have to go through post process treatments such as shotblast, it adds a challenge to the marking properties. These processes may be quite aggressive, shotblasting would literally erase the marks.
After extensively studying this topic for the last three years, Laserax finally found the right laser parameters that allow laser direct part marking to resist most shotblast processes and maintain a high level of quality and readability. The outstanding results obtained during the last year revealed a fast and robust laser marking method that allows for the integration into a die-casting cell without any compromise on throughput. Excellent reading rates of the laser-marked identifiers after shotblast now enables true traceability for die-casters—and paves the way to a new era of accountability and process improvements.
Introduction
The need for the traceability of individual components has increased significantly in the last few years, especially in the automotive industry. The main challenge of direct part marking (DPM) of unique 2D codes on these components has mainly been to decrease marking time to fit it in the available cycle time of the machine as well as creating a code that would resist post-process treatments applied to the part after casting.
For die casting, between 25% and 50% of the components go through an abrasive blasting process in which carbon steel or stainless steel balls are shot on the part to smoothen its surface. The process, called shotblasting, completely erases state-of-the-art laser marking from the part surface. The subject of shotblast resistant laser marking had been investigated in previous publications by our team at the 2017 North American Die Casting Association Congress. Laserax presented a first demonstration of reading a laser-marked 2D code after shotblast. To address the challenges experienced in the die casting industry, a more thorough investigation of various parameters, such as the depth of marking and cell size, was required to optimize the marking process in terms of 2D code quality, contrast and marking time.
Characteristics of the Data Matrix Code
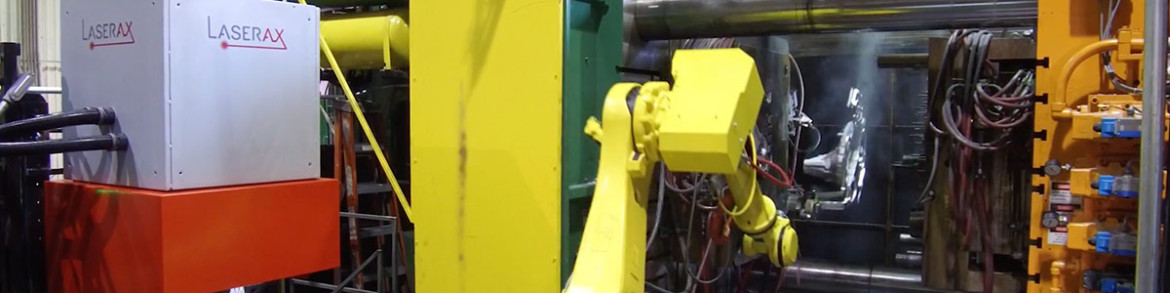
A DMC is a two-dimensional code containing squares, which are either white or black, to represent the encoded information. Every DMC is composed of two solid adjacent borders at the left and at the bottom of the code forming an L. The two other borders of the DMC have alternating white and black cells; it is called the clock pattern. Figure 1 shows an example of this type of code.
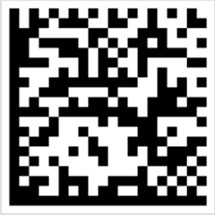
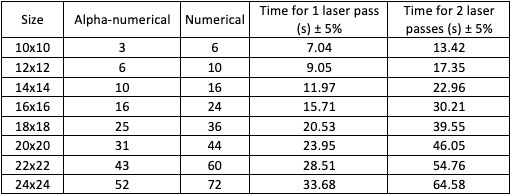
The number of rows and columns included within the DMC is dictated by the amount of data that needs to be encoded. Table 1, as seen below, shows the relation between the number of cells and the data capacity of a DMC. Data storage capacity is greater when encoding only numbers compared to numbers and letters. The size of the DMC illustrated in Figure 1 is 20 x 20, it can contain up to 31 alphanumeric characters.
Laser Direct Part Marking
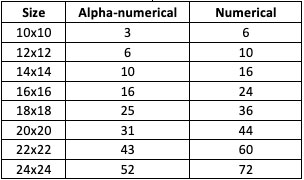
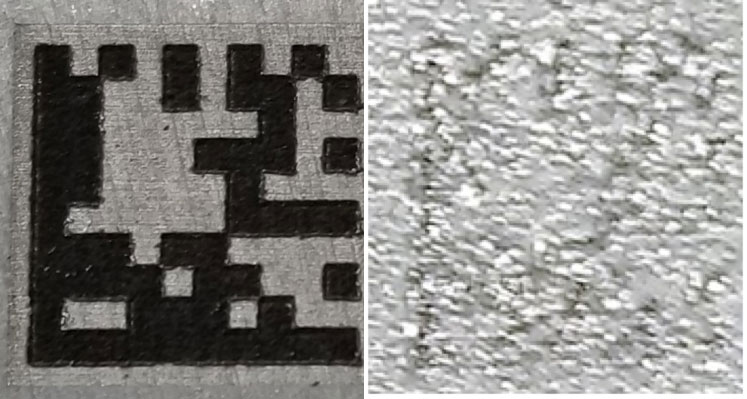
We know from previous studies that the blackening of the metal surface by laser irradiation is due to an increase of the local root mean square RMS value in the black region, which creates light coupling into the material (Maltais et al., 2016)1. The result of a surface profile measurement (Figure 2a) and a picture taken with a scanning electron microscope (SEM) (Figure 2b) are shown below.
Analysis of the Surface Profile Measurement and of the SEM Picture of Regular Laser Markings
In Figure 2a, from 0 to 2000 µm, the surface profile of the original surface has a roughness of a just a few micrometers. The white surface is shown between 2000 µm and 3000 µm. The black surface is shown for positions of 3000 µm and beyond.
In Figure 2b, one can observe an SEM image but only for the black and the white regions of the laser marking. The black region can be seen in the top left corner of the picture. The rest of the image shows the white portion of a laser marking.
The white appearance of laser markings is generated by a high level of diffuse reflection of ambient light from the small wavy structure seen in the picture of the microscope. The dark appearance, on the other hand, is generated by a high level of absorption of ambient light in the velcro-like surface shown in Figure 2b. By adjusting the laser parameters, we can precisely control the surface roughness and then control the greyscale of localized areas.
The impact of Shotblasting on Laser Marked Data Matrix Codes
When a laser marked DMC is shotblasted, the high rough black portion of the marking (top right corner of Figure 2b) gets heavily flattened so that the absorptive surfaces become more reflective. This explains why the contrasts are reduced and the marking becomes barely legible. To preserve the contrasts, we need to protect the black portions of the markings from the shotblast media.
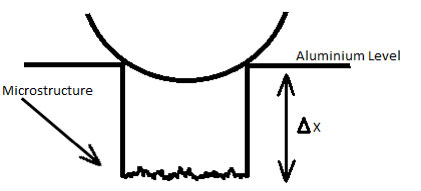
The main idea behind our work into the development of shotblast resistant marking is to have the black portions of the code engraved deeper into the material so that the microstructure, at the bottom of a trench, is protected from the blast media. Figure 3 illustrates the idea. In this example, deep cells with black absorptive microstructure at the bottom are created. The opening of the trench is smaller than the average steel shot diameter used in the shotblast machine.
Experiment
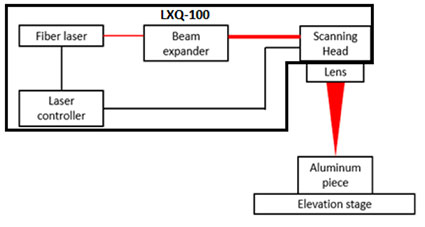
We initially performed DMC laser marking with deep and small cells using an LXQ-100 laser with the setup shown in Figure 4.
The resulting samples were subjected to a shotblast treatments by Cascade Die Casting Group with a Viking Blast (model: CB-3614), shown in Figure 5.

The results were inconclusive. The DMCs with the smallest cells were not readable at all.
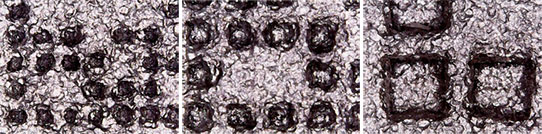
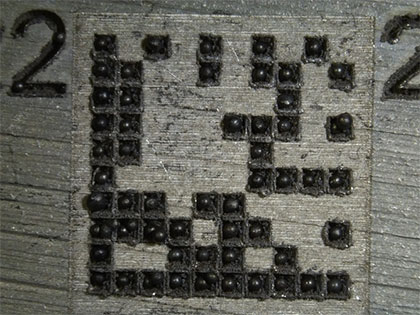
Some of the DMCs with slightly bigger cells were readable, even if their diameters were larger than most of the shotblast media. In fact, for the smallest cells, the surface smoothening generated by the shotblast process flattened the outer walls and clogged the holes. The absence of holes rendered the post-shotblasted code unreadable (Figure 6). We concluded that making cells with dimensions smaller than the blast media was not a viable solution to efficiently protect the blackened surface.
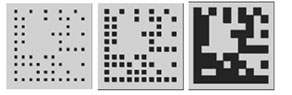
During this experiment, we also observed that for larger cells that were too big to be erased by surface smoothening, the isolated cells in the clock pattern displayed a better contrast than cells that were surrounded by neighboring cells. Figure 7 below shows this phenomenon.
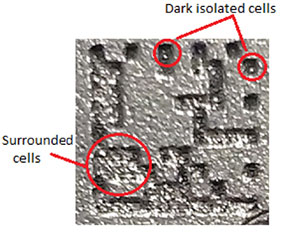
This observation leads us to think that a remaining edge between each individual cell of the DMC would help in preserving the high contrast post-shotblast.
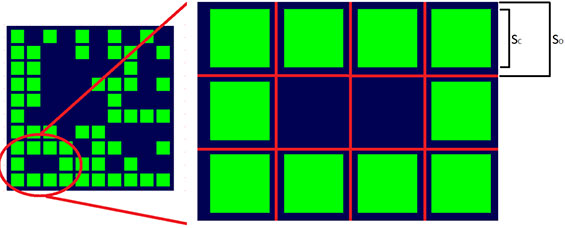
We had the idea of introducing an individual cell “filling ratio” that would help to preserve a surrounding edge around each dark cell. Figures 8 and 9 shows in more detail what these fillings represent. In Figure 9, the module would be full if the filling was 100%. The cell size is defined as SC and represents a percentage of SO.
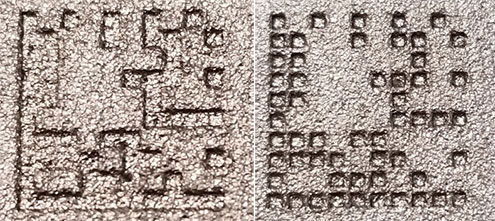
As seen in Figure 10, the contrast on the partially filled matrix was much higher. It had a much better readability rate than the fully filled cell.
The presence of a wall separating the cells was applied to several aluminum samples marked with lasers. These samples were kept at a filling ratio of 80% (this value was experimentally determined to be optimal for the intended purpose).
A total of 85 DMCs (with a size of 10 x 10) were created using a Laserax LXQ-100 (100W) fiber laser on an aluminum alloy containing 8-10% Si (Aural 2TM). The 85 samples were kept with a filling of 80%; however, the cell size varied from 0.3 mm to 1.6 mm.
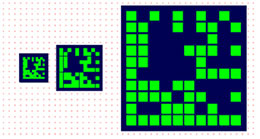
In terms of optimization, cell size and depth were the two parameters that were varied from one sample to another. Depth was varied by changing the number of times the laser would pass over the marking. The laser passes varied from 1 to 5 and then translated to physical measurable depths with a surface profiler (model DEKTAK 150). Increasing the cell size has the effect of increasing the overall size of the matrix, as can be seen in Figure 11 below.
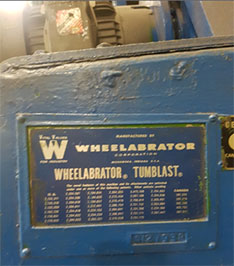
The shotblast process was conducted on a Wheelabrator Tumblast (seen below Figure 12) with S170 type cast steel ball (average shot size of 0.430 mm) at Groupe Canimex in Drummondville, Québec. The process lasted a total of 90 seconds.
The 85 markings were analyzed for their contrasts before and after the shotblasting process using the Cognex camera DM262X. The contrast value was calculated according to ISO 29158 using the following equation:
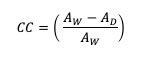
The DM262X camera divided every pixel into greyscales and assigned it a value from 0 to 255. An algorithm is used to segregate the light pixels from the dark pixels. Aw is the average value in bits (0 to 255) of the light area while AD is the average value in bits (0 to 255) of the darker area. Contrast is therefore defined as the ratio between the difference in light and dark areas and the light area.
Experimental Results of Shotblast Resistant Marking
The first step in evaluating a code’s optimal settings for a shotblast resistant marking is to ensure its readability after post-treatment. Figures 13 and 14, as seen below, show pictures of the markings before and after the shotblast treatment.
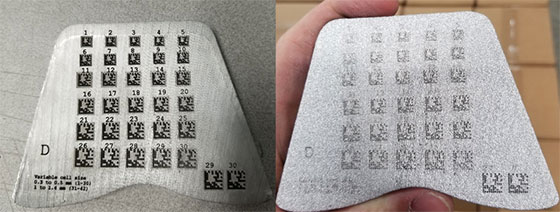
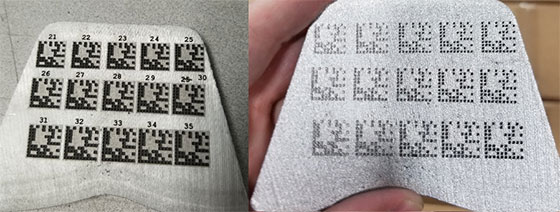
It is important to mention that the apparent contrast of the codes displayed on the pictures above depends on the ambient lighting and viewing angle. To circumvent this issue and obtain objective data while reducing the number of variables, a barcode reader, the DM262X, was installed on a fixed mount. The angle of view and the lighting was therefore kept constant and did not influence the value of the contrast from one measurement to another.
According to the direct-part marking certification, ISO 29158, many criteria, such as cell contrast, cell modulation as well as the axial and grid deformation, need to be evaluated in order to assess the grade of the marking. These grades provide a quantitative tool to evaluate the readability of a code. A grade A per ISO 29158 is the best grade, while a grade F is the worst. The grade quality of a code always represents the lowest grade value for all criteria. A code that has a grade value A for contrasts can still end up being a C due to a lower grade value obtained for any of the other criteria (cell modulation, axial and grid deformation, etc.). All the 85 DMCs made for this experiment were given an overall A grade by the DM262X camera before the shotblast process. Table 2 below shows the overall grade quality of the markings post-shot-blast.
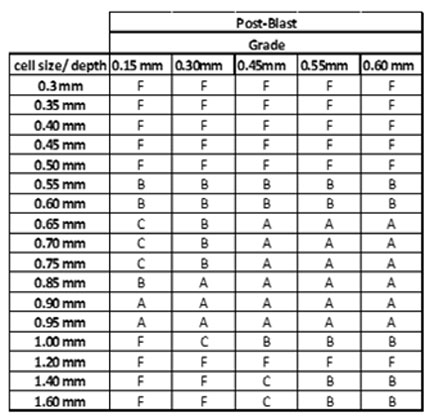
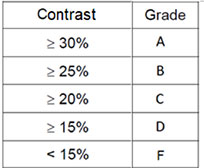
The contrast, being central in the evaluation of code quality, was used as a quantitative tool for the post-blast markings in this experiment. Table 3 below gives the grade equivalence to contrast per ISO 29158.
The following subsections present graphics of the measured contrast values in relation to cell size, depth and marking time.
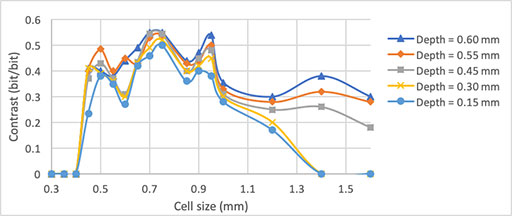
Impact of Cell Sizes on Contrast after Shotblasting
Figure 15 below shows how the contrast changes with respect to cell size with each set of markings. We can observe the presence of three different sections. The first section spans from 0.3 mm to 0.5 mm, in which the contrast is zero for the smallest cells (a non-readable DMC have been assigned a zero value for the contrast) and increases as the cells get bigger. In the second section of the graph spanning from 0.5 mm to about 0.9 mm, the contrast exhibits some variations. However, it remains quite high throughout this range. The third section covers larger cells spanning from 0.95 mm to 1.6 mm and shows a higher dependency on the cell depth along with a general decrease of the contrast as the cells get bigger.
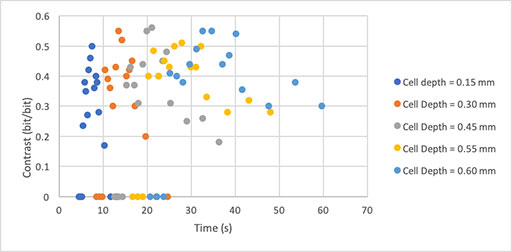
Impact of Cell Depths on Contrast after Shotblasting
Figure 16 shows how the contrast changes with depth for all readable DMCs.
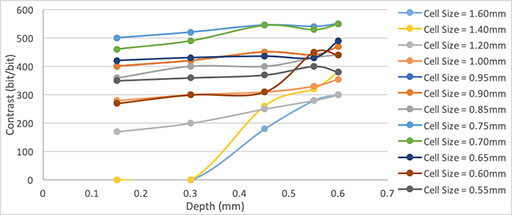
This graphic shows that larger cells are more affected by a depth variation than smaller ones. In fact, for the middle section containing a cell size ranging from 0.50 mm to 0.90 mm, the contrast is only slightly affected by the change in depth. The third section, which has sizes between 0.95 mm and 1.60 mm, are much more affected by the depth of the cell. For the bigger cells, 1.40 mm and 1.60 mm, it appears that there is even a minimum depth that must be achieved in order to calculate a contrast.
Time Required to Do Shotblast Resistant Marking
The relationship between the various parameter combinations and marking times are shown in Figure 17.
From Figure 17, it appears obvious that the third to fifth laser passes (cell depths of 0.45 mm to 0.60 mm) require much more time to give a similar contrast. By eliminating the third to fifth laser pass from Figure 17 and removing cells that were either too small (beneath 0.5 mm) or too big (over 1 mm), we obtain Figure 18.
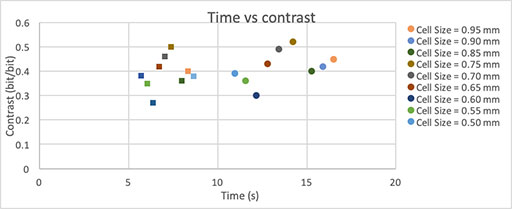
As shown in Figure 18, there are multiple configurations available to create a shot-blast resistant marking that optimizes both time and contrast. In fact, if 6 or less numeric characters are to be encoded (corresponding to the capacity of the 10X10 DMC of this study), it is possible to create a shot-blast resistant mark in less than 10 seconds while maintaining a relatively high contrast that allow consistent reading and high-grade code (A or B). Although the camera gave similar contrast values to the codes with 1 pass and 2 passes, better overall quality and grading were obtained for 2 passes.
Analysis of Experimental Results for Shotblast Resistant Marking
The results show that DMCs with individual cell sizes smaller than approximately 0.5 mm exhibit a much lower contrast or are not readable with the camera. Our initial hypothesis was that having a small cell size would prevent the steel ball from getting inside the marked hole and thereby preserve the contrast after shotblasting since the bottom surfaces of the cells would keep their microstructure. However, by taking a closer look at the samples with cell sizes < 0.5mm, it seems that the holes are clogged by the flattened surfaces around them. This can be observed in Figure 6. This is not too surprising since aluminum is a soft and ductile material while steel is comparatively much harder. An impact by a steel ball on an aluminum surface would undoubtedly deform the surface and clog the smaller holes. These clogged holes make the code unreadable in general. As a result, larger cell sizes are more desirable to obtain a readable code after shotblasting.
Above 0.5 mm and up to approximately 0.9 mm, contrast is good and quite constant. Above 0.9 mm, the contrast tends to decrease up to the maximum cell size of 1.6 mm (as tried in this experiment). However, the depth unexpectedly didn’t have a high impact on the contrast. Based on the main idea of having the bottom absorptive surface of the cells protected by the surrounding walls, we performed a geometrical analysis of the crater shape with respect to the shot dimension to get a better understanding of the physical phenomenon.
Geometric Analysis
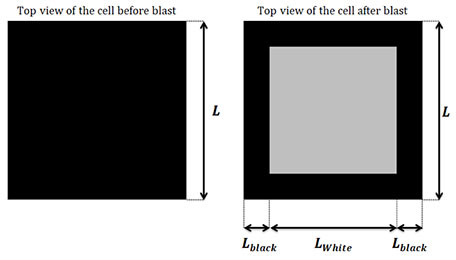
During the shotblast process, a high number of steel balls hit the surface from every direction. This has the effect of polishing the surface on which the ball come into contact. In the case of black-marked cells, the polishing effect destroys the microstructure and increases the amount of light reflected at the bottom of the cell. In this analysis, we suppose that the only areas that will remain black are the area where the shotblast steel balls cannot be in direct contact with the surface. Figure 19 below shows the analysis.
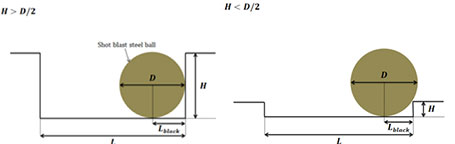
The parameters D, H, L and Lblack are the diameters of the shotblasted steel ball, depth of the cell, length of the cell and length of the remaining dark area, respectively. For simplicity, this analysis neglects the deformation of the walls and the steel balls. Figure 20 below shows a schema of the phenomenon.
The theoretical value of L Black is given by:
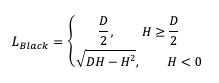
It is then possible to calculate the proportional area of the cell that will remain black after the shotblast.
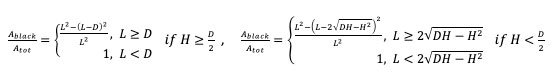
Figure 21 below clearly shows that the geometrical analysis above is effectively observed in the results.
These equations obtained from the geometrical analysis are represented graphically in Figures 22 and 23 below and compared with the experimental results. The value of D is set to 430 µm, which is the average diameter of S170 cast-steel shot.
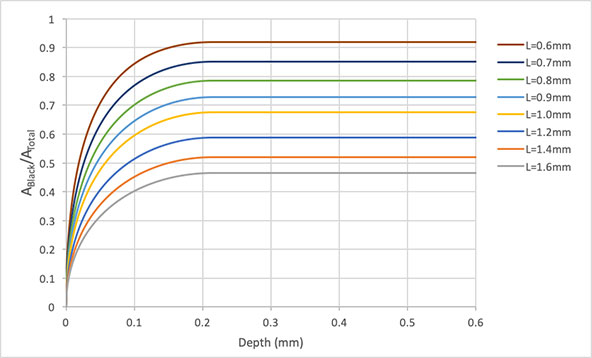
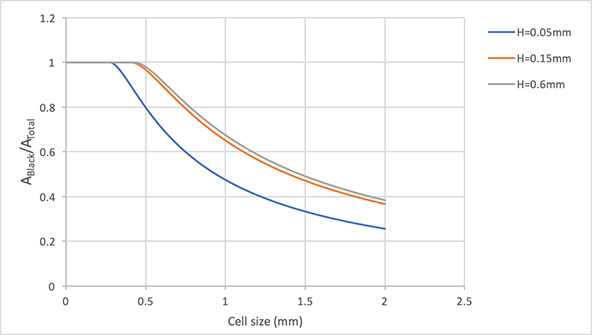
A correlation between the experimental and theoretical results can be observed. In fact, this geometrical model presents a good example as to why the depth of the cell only has a small impact on the contrast and why the contrast decreases for cell size bigger than the shot size. Past a certain critical depth value (D/2), the proportion of dark area does not increase for bigger depths and is only affected by the size of the cell.
Our geometrical model is therefore clearly demonstrating the DMC contrast that was modified by the shotblast process, except for the smaller cells in which the surface smoothening that clogs the holes is the dominant effect.
Efficient shotblast resistant marking should exhibit an approximate 80% filling ratio, a depth around D/2 or higher (typically 200 µm), and an individual cell size that ranges between 0.55 mm and 0.95 mm. The final choice of cell size should be a compromise between short marking times (0.55 mm to 0.75 mm) and highest grade (0.85mm to 0.95mm). At this cell size, it is possible that certain marking get the steel carbon shots stuck within the cell as shown in Figure 24 below. The stuck shot media responded as a black cell and thus allowed was successfully re-read.
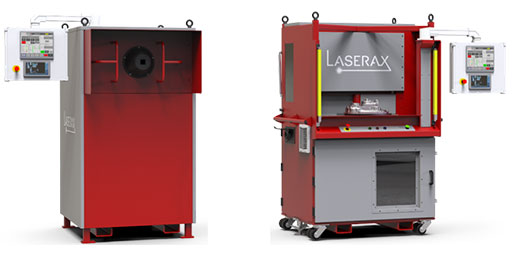
Inline and Offline Integration of Industrial Laser Marker in Diecasting Cells
There are two different types of machines recommended for the integration of shotblast resistant marking in a die casting cell: Open air enclosures and rotary table enclosures. These two machines are represented in Figure 24 below.
A comparison of the advantages and disadvantages of both machines are shown in Table 4 below.
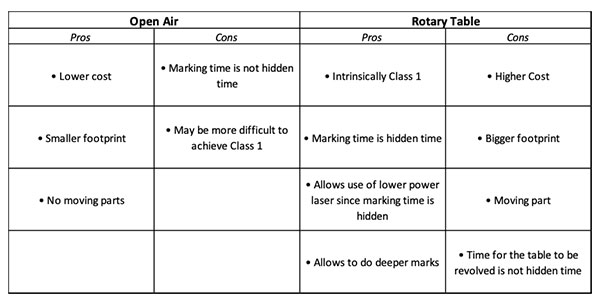
Table 5 below show the relation between storage capacity and marking time, for the 0.70mm cell size and 1 or 2 passes.
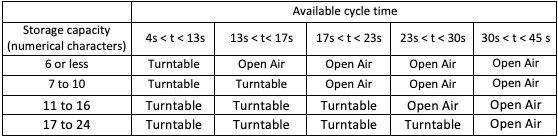
Depending on the cycle time available in the process and the amount of data to be encoded, the right choice of enclosure type is shown in Table 6. Note that Table 6 recommendations consider two laser passes and a cell size of 0.70 mm.
Conclusion
Laser marking remains the most viable and most reliable technology for permanent markings on components to ensure traceability. The ever-growing challenges that arise by the direct part marking sector can be readily answered by laser technology. The need for shot-blast resistant marking, which optimizes both the time of marking and the readability of the code, can be addressed by Laserax’s LXQ-100 laser system. For DMCs with small data storage capacity (six numerical characters or less) marking times under 10 seconds can be achieved while maintaining a B or better grade when compared with ISO 29158 standards. We also demonstrated that higher-storage capacity DMCs can maintain their high grades after shotblasting can be obtained within reasonable timeframes. Finally, we explained which enclosures are the more suitable, depending on data storage requirements and available cycle times within casting processes. Based on these breakthroughs, diecasters can now seriously consider implementing in-line laser marking solutions in their diecasting cells even if parts are subject to post-treatment shotblasting.
Acknowledgments
We want to thank our partners for this project: Cascades Die Casting Group, Mercury Marine and Groupe Canimex for their support and to allow using their shot blasting equipment for this study.
References
1. Maltais, J., Brochu, V., Frayssinous, C., Vallée, R., Godmaire, X., Fraser, A. “Surface analysis study of laser marking of aluminium,” ICSCOBA 2016